
Census & Demographics
CRC provides up-to-date population, housing, labor force, and economic data to support local planning, grant writing, and community development across Virginia’s Heartland.
Key Metrics Snapshot
Regional Population
Households
Labor Force
Median Age
Demographic Trends
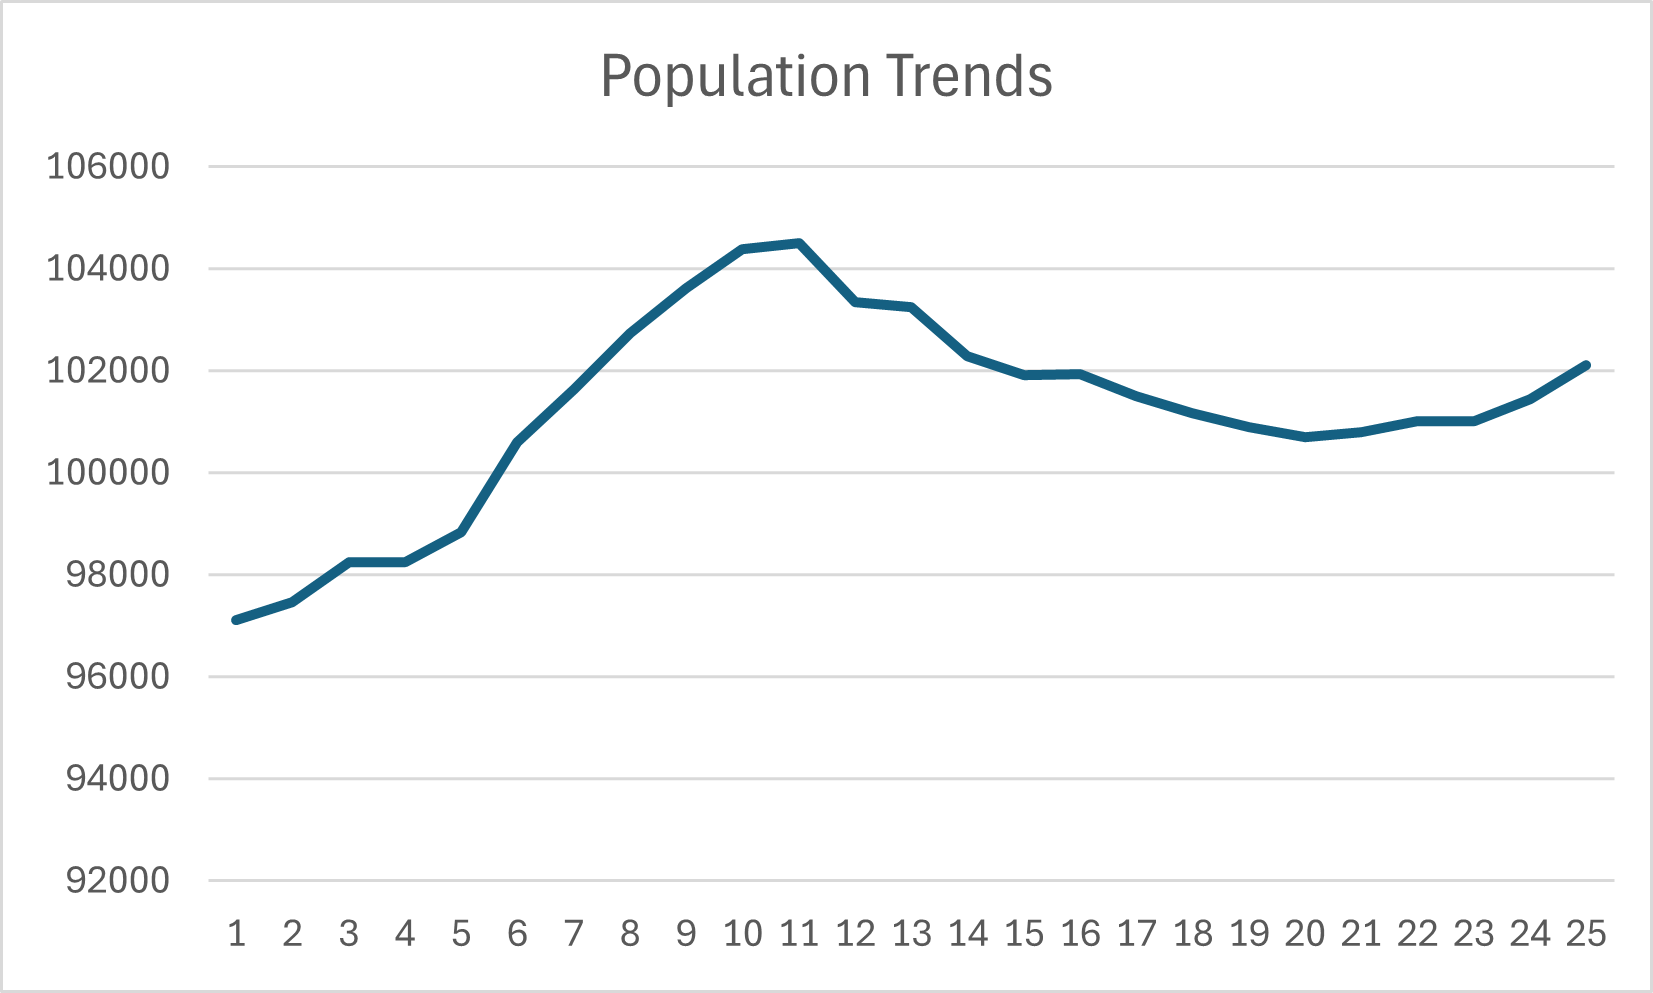
Population Trends
The region’s population has remained stable over the past two decades, with slight growth since 2020 following a dip in the 2010s.
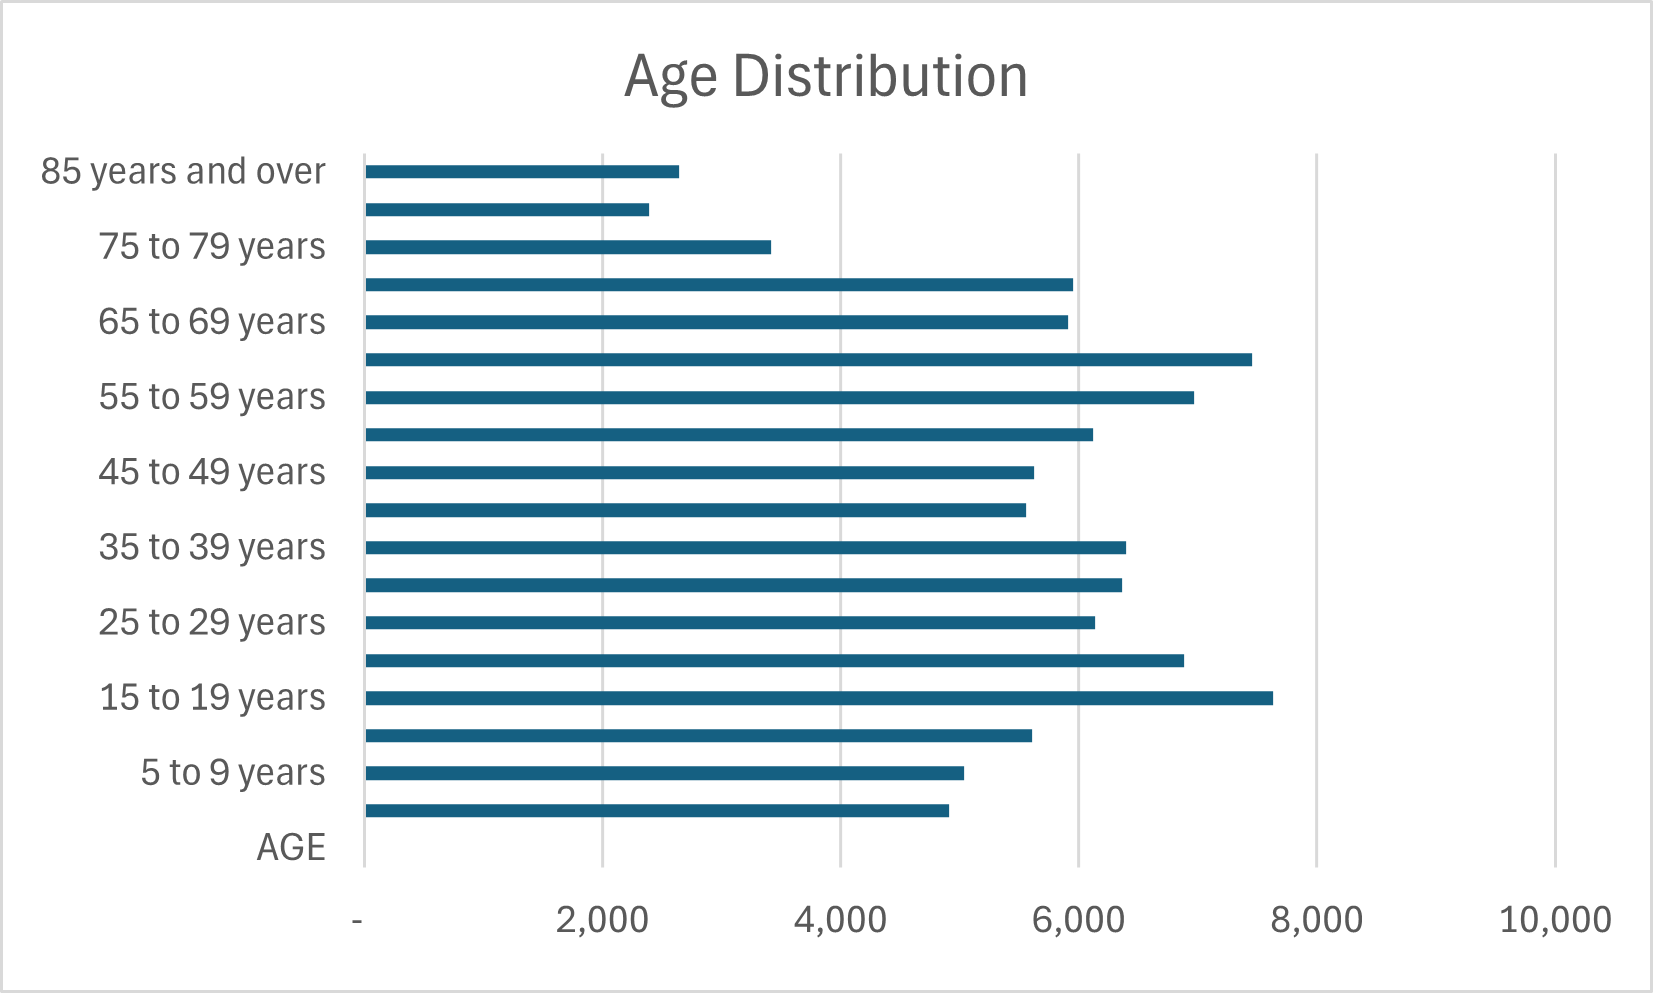
Age Distribution
The regional median age of 41.5 reflects a balanced but aging population, with notable growth in residents aged 55 and older.
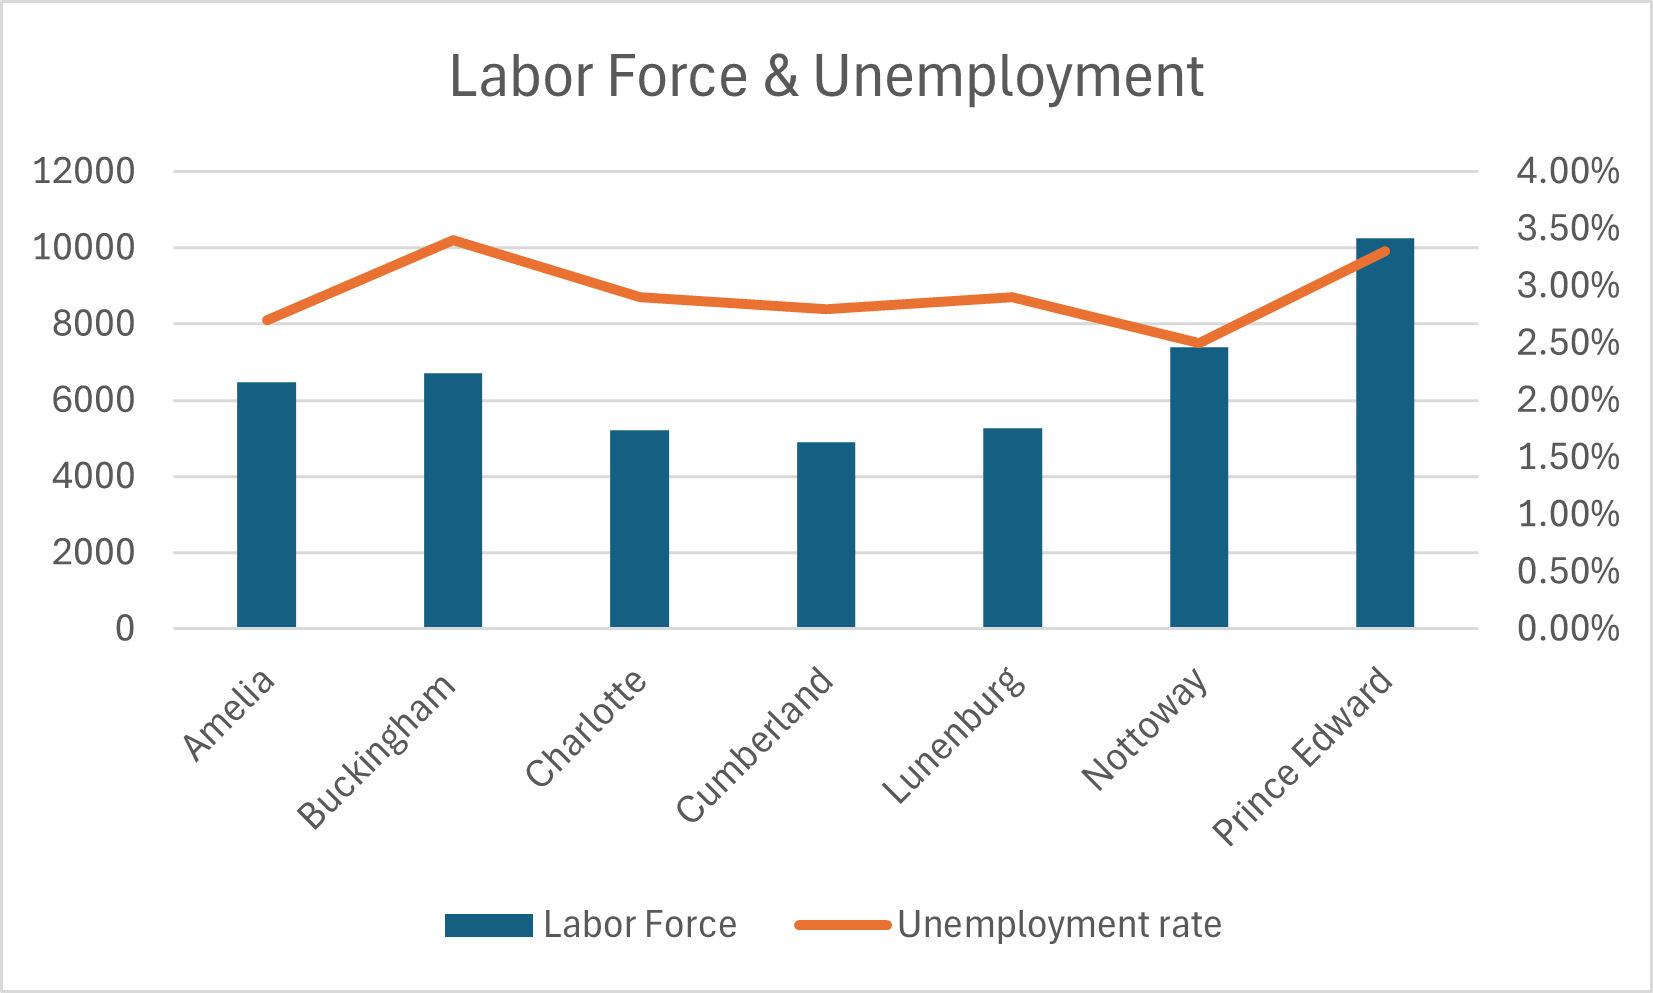
Labor Force & Employment
The regional labor force totals over 84,000, with unemployment rates consistently below 4% across most counties.
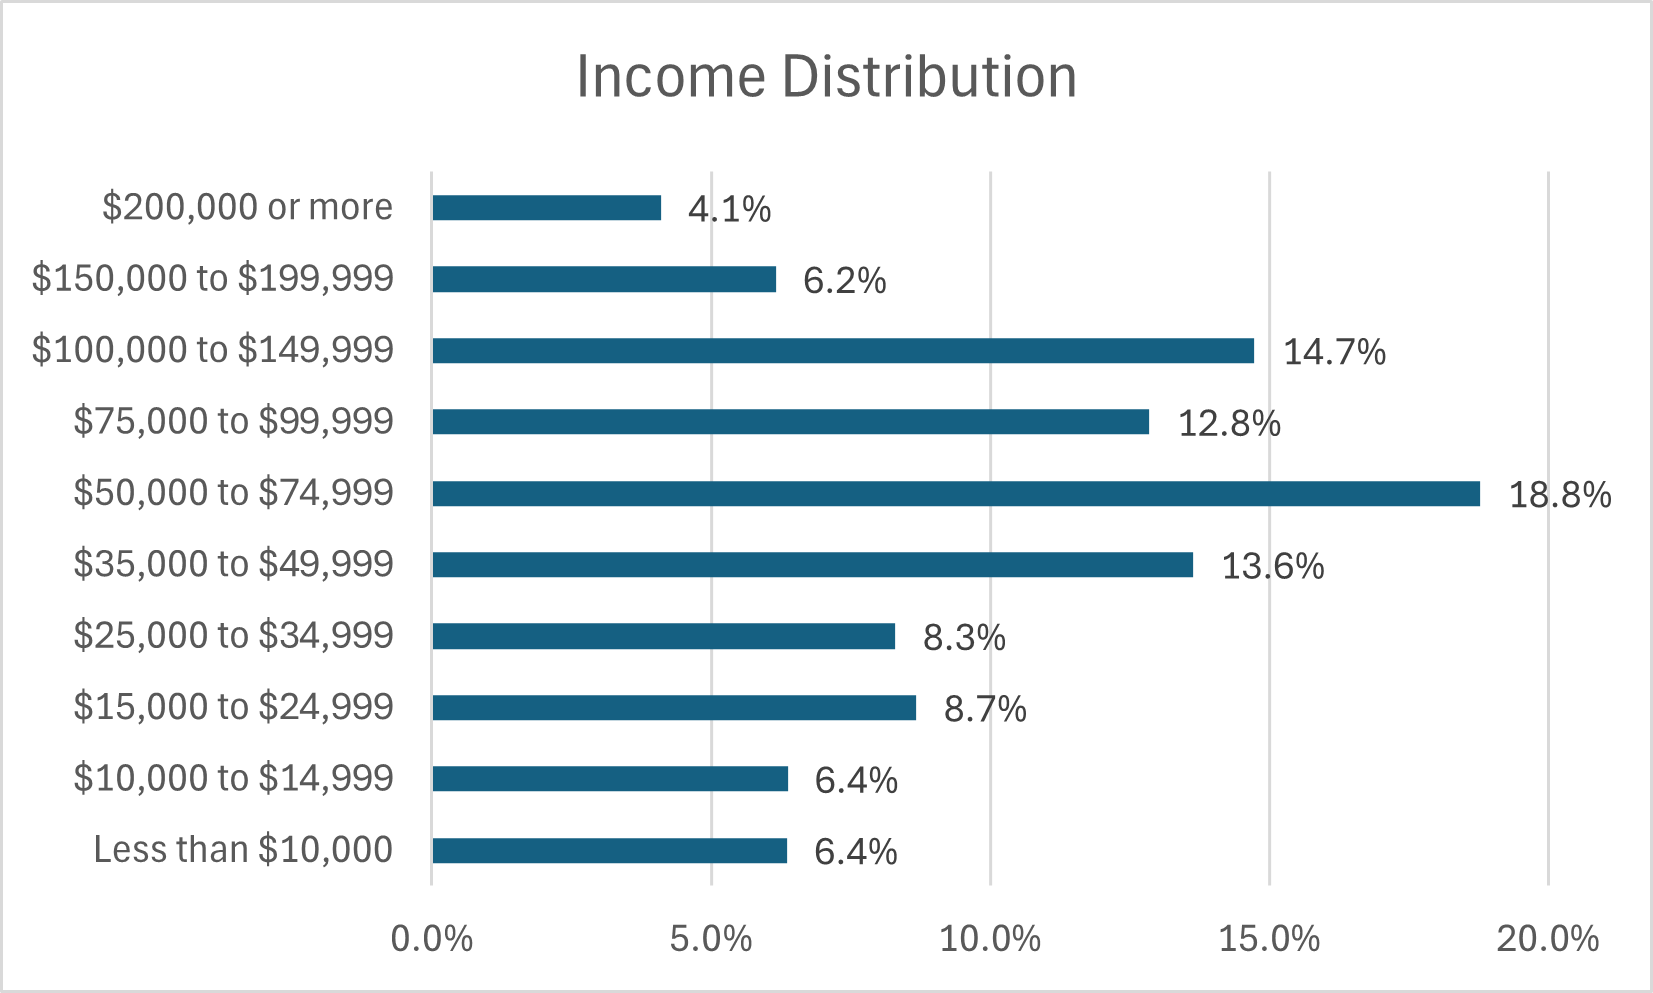
Income Distribution
About one-quarter of households in the region earn above $100,000 annually, while the largest share (37%) fall between $35,000 and $75,000
County Specific Data
Amelia
Amelia County — Snapshot
Population: 13,716 Households: 5,285 Median Age: 45.1 Median HH Income: $63,500
Demographics
• Change since 2010: +3.2% • Under 18: 20.1% • Age 65+: 19.8%
• Median age: 45.1
Workforce & Income
• Labor force: 6,465 • Unemployment: 2.7%
• Median household income: $63,500 • Poverty rate: 10.6%
Housing
• Housing units: 6,012 • Owner-occupied: 74%
• Median rent: $980
Education & Commuting
• Bachelor’s+ (25+): 20% • Mean commute: 32 min
• Work outside county: 58%
Buckingham
Buckingham County — Snapshot
Population: 17,115 Households: 6,062 Median Age: 44.2 Median HH Income: $57,100
Demographics
• Change since 2010: +2.9% • Under 18: 19.4% • Age 65+: 20.7%
• Median age: 44.2
Workforce & Income
• Labor force: 6,705 • Unemployment: 3.4%
• Median household income: $57,100 • Poverty rate: 13.2%
Housing
• Housing units: 7,020 • Owner-occupied: 72%
• Median rent: $920
Education & Commuting
• Bachelor’s+ (25+): 17% • Mean commute: 31 min
• Work outside county: 59%
Charlotte
Charlotte County — Snapshot
Population: 11,258 Households: 5,492 Median Age: 47.8 Median HH Income: $48,900
Demographics
• Change since 2010: –7.6% • Under 18: 18.3% • Age 65+: 22.9%
• Median age: 47.8
Workforce & Income
• Labor force: 5,292 • Unemployment: 3.5%
• Median household income: $48,900 • Poverty rate: 14.8%
Housing
• Housing units: 6,150 • Owner-occupied: 75%
• Median rent: $810
Education & Commuting
• Bachelor’s+ (25+): 16% • Mean commute: 29 min
• Work outside county: 57%
Cumberland
Cumberland County — Snapshot
Population: 10,062 Households: 3,978 Median Age: 43.7 Median HH Income: $54,500
Demographics
• Change since 2010: +7.6% • Under 18: 21.1% • Age 65+: 17.3%
• Median age: 43.7
Workforce & Income
• Labor force: 4,221 • Unemployment: 3.0%
• Median household income: $54,500 • Poverty rate: 12.4%
Housing
• Housing units: 4,430 • Owner-occupied: 73%
• Median rent: $900
Education & Commuting
• Bachelor’s+ (25+): 19% • Mean commute: 33 min
• Work outside county: 62%
Lunenburg
Lunenburg County — Snapshot
Population: 12,415 Households: 5,122 Median Age: 45.6 Median HH Income: $54,460
Demographics
• Change since 2010: –4.7% • Under 18: 18.6% • Age 65+: 20.4%
• Median age: 45.6
Workforce & Income
• Labor force: 5,612 • Unemployment: 3.1%
• Median household income: $54,460 • Poverty rate: 15.2%
Housing
• Housing units: 5,610 • Owner-occupied: 71%
• Median rent: $850
Education & Commuting
• Bachelor’s+ (25+): 15% • Mean commute: 30 min
• Work outside county: 55%
Nottoway
Nottoway County — Snapshot
Population: 15,853 Households: 5,492 Median Age: 44.3 Median HH Income: $62,100
Demographics
• Change since 2010: –3.1% • Under 18: 19.0% • Age 65+: 19.6%
• Median age: 44.3
Workforce & Income
• Labor force: 6,165 • Unemployment: 3.1%
• Median household income: $62,100 • Poverty rate: 13.5%
Housing
• Housing units: 6,210 • Owner-occupied: 70%
• Median rent: $870
Education & Commuting
• Bachelor’s+ (25+): 18% • Mean commute: 28 min
• Work outside county: 56%
Prince Edward
Prince Edward County — Snapshot
Population: 22,119 Households: 7,560 Median Age: 32.1 Median HH Income: $55,100
Demographics
• Change since 2010: –1.6% • Under 18: 16.9% • Age 65+: 14.7%
• Median age: 32.1
Workforce & Income
• Labor force: 9,221 • Unemployment: 3.2%
• Median household income: $55,100 • Poverty rate: 20.4%
Housing
• Housing units: 8,420 • Owner-occupied: 60%
• Median rent: $890
Education & Commuting
• Bachelor’s+ (25+): 24% • Mean commute: 27 min
• Work outside county: 52%